


You have delivered the dashboard. It is beautiful, real-time, and built on a modern data and analytics stack. Yet, your executive team still starts every meeting with the same question: "Where did this number come from?"
This is the Trust Gap. It is the distance between the data you provide and the confidence your stakeholders have in using it.
According to the 2025 Data Integrity Trends and Insights report by Precisely and Drexel University, 67% of organizations don't completely trust their data for decision-making, up from 55% just one year prior. They didn't lack data, but they lacked certainty.
When executives cannot instantly verify the provenance of a KPI, they do not "trust but verify." They simply ignore it. They revert to static spreadsheets and offline modes, creating a cycle of shadow IT that further erodes the integrity of your analytics. Gartner research confirms this pattern: 69% of employees have intentionally bypassed cybersecurity controls, often using unauthorized tools when they don't trust official systems.
→ Related: Tableau Sprawl Is Costing You Twice: Why Dashboard Chaos Kills Both Trust and Cloud Budgets
The Root Cause: Dissonance, Not Just Quality
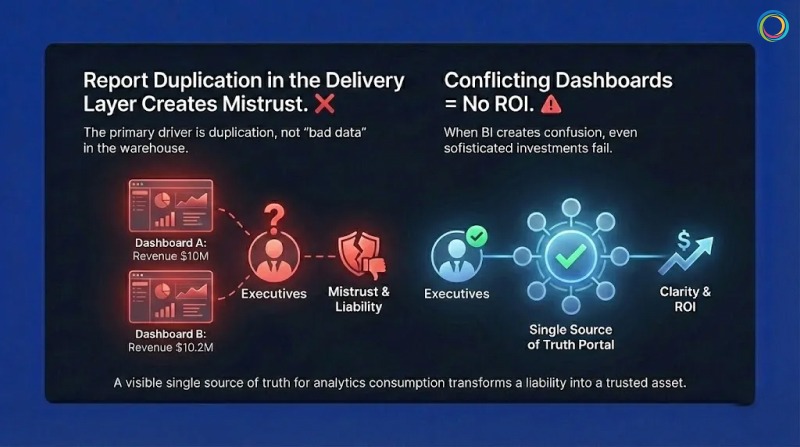
The primary driver of this mistrust is not usually "bad data" in the warehouse; it is report duplication in the delivery and consumption layer.
In a typical enterprise, it is common to find dozens of reports with nearly identical names like Sales_v1, Sales_Final, Q3_Sales_Update. When a VP searches for "Revenue" and finds 15 conflicting versions, they experience data dissonance.
If Dashboard A says revenue is $10M and Dashboard B says $10.2M (due to a different refresh cycle or filter logic), the executive assumes both are wrong. Without a visible single source of truth for analytics consumption, the platform is viewed as a liability, not an asset.
A 2025 Salesforce survey found that less than half of business leaders say their data strategies fully align with business priorities - a significant decline since 2023. When your BI dashboards create confusion rather than clarity, even the most sophisticated analytics investment fails to deliver ROI.
The Solution: From "Gatekeeping" to "Signposting"
Traditional governance attempts to solve this by restricting who can build reports. This fails because it stifles agility. The modern approach (BI Ops) focuses on signposting the truth rather than hiding the noise.
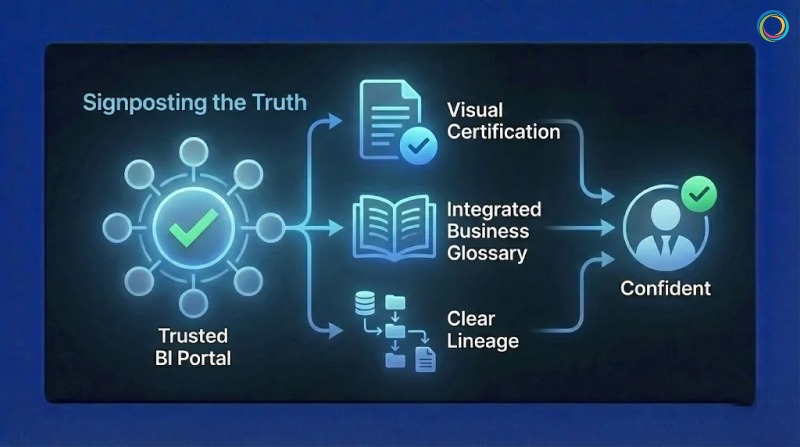
To bridge the Trust Gap, you must implement three visible signals of authority within your BI portal:
1. Visual Certification (The "Blue Checkmark" for BI)
Your users are trained by consumer apps to look for verification symbols. Your self service analytics or BI portal should work the same way.
The Strategy: Implement a strict governance and certification workflow where only validated, business -approved assets receive a "Certified" watermark, not just data stewards.
The Outcome: When a user searches for a report, they can instantly filter out the noise and click the asset that is stamped as the corporate record. This eliminates the "which one is right?" guessing game.
2. Integrated Business Glossary
Numbers without context are dangerous. If a report lists "Churn Rate," does that include involuntary cancellations?
The Strategy: Link your BI glossary directly to the report metadata.
The Outcome: A user can hover over a term and see the approved corporate definition, the owner of the metric, and the calculation logic. This transparency builds confidence that the metric is standardized, not ad-hoc.
3. Clear Lineage
Trust requires traceability.
The Strategy: Show the user the journey of the data.
The Outcome: When an executive sees that a dashboard is fed directly from the "Gold" layer of the data warehouse and was refreshed 5 minutes ago, they stop asking, "Where did this come from?"
One of the world's leading bakery product companies faced a challenge familiar to many large enterprises: a complex reporting environment characterized by scattered assets and a lack of trust in data insights.
Leadership identified that users were overwhelmed by information and skeptical of the metrics presented. They didn't need more reports; they needed clarity.
The "One Stop" Strategy: This company deployed the ZenOptics Analytics Hub to create a branded "One Stop" shop for enterprise data. Instead of fighting report sprawl with restrictions, they used the platform to:
- Centralize Access: Bringing disparate reports into a single view.
- Certify Trust: Explicitly identifying trusted reports so users knew exactly which assets were safe for decision-making.
- Eliminate Redundancy: Preventing multiple teams from creating duplicate reports by making existing assets easy to find.
The Result: By funneling users through a governed, certified layer, they established a culture where "One Stop" became the definitive source of truth. They effectively mitigated the risk of shadow IT and ensured that strategic decisions were based on governed, reliable data.
Trust is not a soft skill; it is an engineered outcome. You build it by removing friction and adding clear signals of validity.
If you want executives to believe your dashboards, you must stop asking them to hunt for the truth. Certify your best assets, define your terms, and make the "source of truth" obvious. When you do that, you don't just get more dashboard views - you get a data-driven culture.
Published January 16, 2026